
HERE is not THERE (a Thread on New Homes)
Markets differ. The news doesn't seem to grasp that simple fact.

OK, we are going to open with a quick play to illustrate a point.
< scene open >
Imagine a couple sipping coffee and starting the day with a discussion of the weather.
‘Hey, honey, what’s the weather today?’
‘25 degrees with a chance of snow.’
‘IN JUNE?!?’
‘Oh, I was telling you what was happening in Anchorage.’
Audience applauds.
< scene close >
Does that conversation ever happen? Of course not.
Well, unless it is 2025 and you are reading something about the real estate market.
Here is Not There
"The goal of the media is to make every problem, your problem." - Naval Ravikant
A chart showing the number of new homes for sale has been making its way around on social media recently, and it is causing quite a stir.
I have been sent this article (or a version of it) and / or this chart by numerous folks — and I have even seen some of my peers quoting the stats as if it is the reality here in our market.
SMH.

Newsflash, it isn’t true.
Look, I don’t doubt the accuracy of this chart when talking about the US market in total, but as with anything real estate, markets are local and telling me that the sum total of unsold houses in the US is peaking right now is akin to telling me that there is traffic somewhere on I95.
Just like with the weather or traffic, I want to know what is happening here, in my real estate market, and why.
Telling what is happening in the aggregate means little.
Bifurcation
A few weeks back, we touched on the idea that the US Housing Market is divided into pretty much 2 markets:
Those with inventory levels still quite low.
Those with inventory levels that are high, or at least rising.
Reminder, where there are more buyers than sellers, prices are still rising — and in most markets in the North / Northeast, those conditions persist.
The map below illustrates what is happening quite well and it shows how areas in the North / Northeast differ sharply from areas in the South and Southeast.

Unlike 2008, when everything went down everywhere and all at once due to a collapse in lending, today’s markets are geographically divergent with the NE corridor still lacking inventory and southern markets seeing inventory rising.
What is the result?
A highly varied level of price appreciation / depreciation that is region specific.

What is so frustrating is that the housing trolls have glommed onto this statistic and applied it uniformly across the board (again) in an attempt to get eyeballs and clicks.
Sorry, but that is as irresponsible as it is incorrect.
Markets differ.
Let’s discuss why they differ and what is happening in ours.
Building is the Difference
Why are market behaving so differently?
Homebuilding.
The insatiable demand of the Millennial Generation for all things isn’t a secret, and housing is one of many products that Millennials require.
But building housing for this generation isn’t as easy as building an iPhone — especially not in mature markets where undeveloped land is scarce or where the regulatory burden is heavy.
The inventory rich markets have the ability to build housing at scale, and that has taken a lot of pressure off prices. Where you can build, especially at low(ish) costs, prices have moderated. Where building is a challenge, prices have remained elevated.
And make no mistake, RVA is not an easy place to build, especially at scale.
Why?
Our lot supply is low, our costs to build are high, our infrastructure is inadequate (think about the multiple ‘boil water advisories’), and the scale of our communities is dwarfed by those in places like Florida, Texas, and Arizona.
What Happened?
As mentioned earlier, the narrative that the available number of new homes is at its highest level since the Great Financial Crisis is the housing troll’s current hot take.

I have been sent the article by many of you with the question, ‘Is this true?’
Perhaps it is true of the nation as a whole, but Richmond? Not so much.
Let’s look at what is happening here (because I don’t live ‘there.’)
New Home Inventory is Actually DOWN!
Yes, you read that right.
The standing inventory of new homes in Richmond is actually down, not up.
Wait, what?!?
Yup. Down.
Currently, the number of new homes in our MLS is down from where it was a year ago and down from pretty much every other timeframe excepting the immediate aftermath of COVID and the ‘Great Migration.’

After briefly getting cranked up in the aftermath of Covid, the number of new home listings has fallen off a cliff.
As of 6/4/25, our MLS shows:
64 new homes completed and ready for occupancy
190 are currently under construction
271 are ‘To Be Built’
Why are there so few new homes in our market? The answer is simple — lot supply. You can’t build a house unless you have a lot to put it on.
Housing Doesn’t Float
Sorry to burst the bubble of those who think that we can snap our fingers and ‘Well, let’s just build more houses,’ but it doesn’t work that way.
Building a house takes about 9 to 12 months for your basic home, but creation of building lots takes years.

Between the multi-year entitlement process (which offers no guarantee you will be approved even when you meet with every request issued by the county — read the article above) and the physical construction of the infrastructure to support the housing (water, sewer, curb, gutter, roads, entry features, as well as any other proffers), development is a long and involved process.
As a developer, if you started today, you would not be completing homes for 5+ years — and even then, most counties limit the number of homes that can be built and sold per year so as to not overwhelm the public services (schools, fire, police, and EMT.)
And did I mention the fact that nobody wants new development nearby?
Lot development has a lot of headwinds.
Existing Lots Are Way Down
Don’t believe me?
Look at what happened to lot supply since COVID — a steady march to the lowest point in the last 20+ years. And it should be noted that Richmond was some 250,000 people smaller in 2004, too, so the fact we have fewer lots today than we did 20 years ago should tell you extreme the problem is.

And while the MLS is not the primary place where building lots would be found, it does show the overall trend of nearly every available lot being absorbed by builders looking for opportunities to build.
The bottom line is that it’s awfully difficult to get overbuilt when you don’t have enough lots.
Pending Sales
So if there are not enough lots to build on and the standing supply of new homes to purchase is falling, what is happening to sales?
They are falling, too.

So new home sales are down, eh? Gee, I wonder why.
You can’t buy what isn’t built.
Anyone who suggests that the new home market is crashing because sales are down should be sent a copy of this article.
Prices
So how can you really tell if the new home market is crashing?
Sales prices.
If prices are up, then it means that demand > supply.

As you can see, the median price of a new home is +/- $600K, which, btw, is some $190K higher than a median priced resale home.
Currently, the delta between new and resale prices represents the biggest gap between the two in the last 20+ years, with maybe the exception of 2023.
Nothing to see here.
Price vs Price PER FOOT
Now, while the median price of a home is up some $200K in 5 years, median price is a largely function of mortgage rates.
When rates go up, buyers can afford less, and builders need to react to the shifting demand by:
Stripping out upgrades.
Building smaller homes.
Both.
So seeing a slight dip in the median sales price of a new home in 2024 just means that when rates rose, builders started to strip out features and / or build smaller homes to try to pair the pricing with the ability for buyers to afford it.
How do I know this? Look at the price PER FOOT (below.)

While the median price is still up, but flattening to some extent, price per foot is marching relentlessly ahead as if nothing has changed.
The bottom line is that if demand for new homes was falling, you’d find in the prices.
How Much Do New Home Sales Matter?
They matter, and they actually matter now more than ever.
In the past, new home sales made up +/- 15% of the market. It depended when you measured, where you measured, and at what price you measured, but new homes were roughly 1 in 7 homes sold.
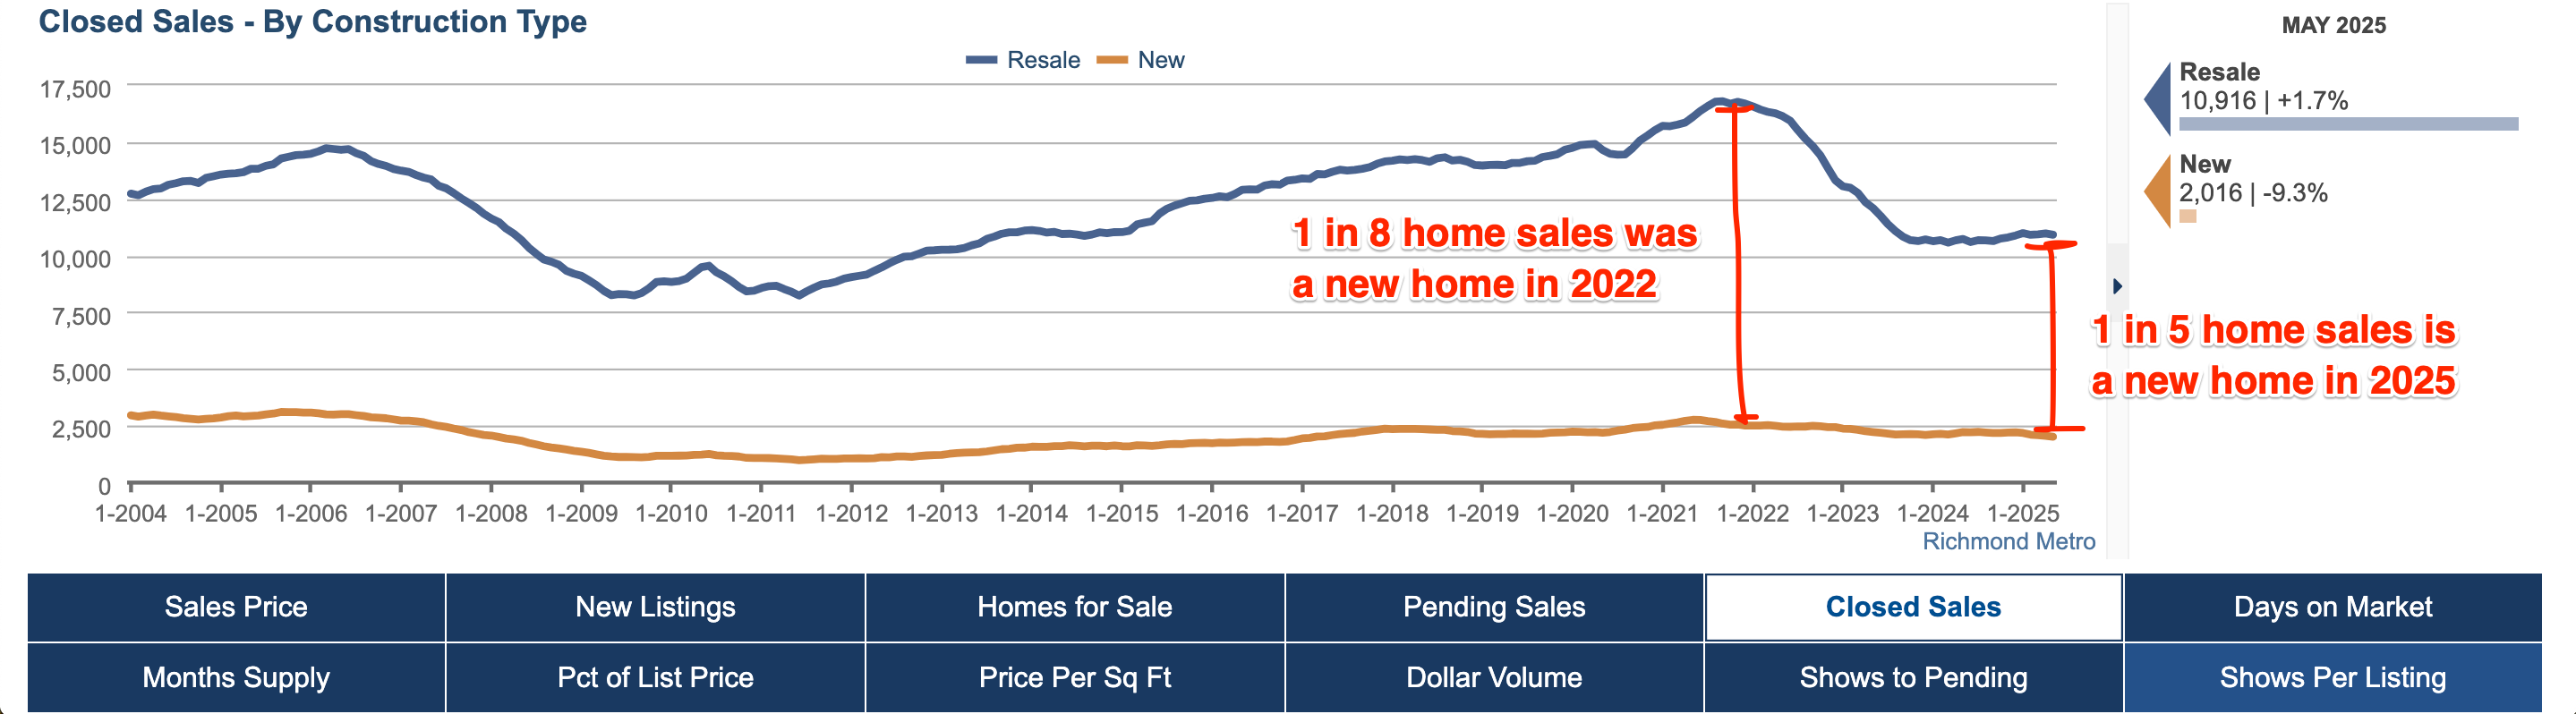
Once the mortgage rates dropped to 3% and everyone refinanced, resale activity ground to a halt and it seemed that the only available homes were the ones getting built.
Almost overnight, our market went from 1 in 8 homes sold being new, to now 1 in 5 is new.
Fill the Void!
So what a great opportunity for builders, right? If the resales aren’t there, then new homes should make up the difference, right?
Yeah, no.
New houses are a function of lot supply, and we don’t have the lots.
I can’t imagine how frustrating it must be for builders to know that this is one of the greatest inventory deficits ever, and they can’t supply the need because the lot supply is lagging — and will be for the foreseeable future.
Keep an Eye on Inventory
If you want to know what is going on, stick to the fundamentals — inventory.
As we have discussed ad nauseam, inventory measures the balance between buyers and sellers — and it measures it in near real time.

Right now, we have 1.6 months of supply, which is far below the 6 month level that generally causes prices to flatten and / or fall.
Again, nothing to see here, either.
But We Are Up From 2022!
Are there more homes on the market today than there were in 2022?
Yes.
But 2022 was not the norm. 2022 was an extreme outlier brought on by a combination of free money and the ‘work from home’ movement.
In the same way that 95 degrees feels cooler than 102 degrees, it still isn’t anywhere near cool. Comparing any year to 2022 isn’t really valid.
No need to panic.
Summary
So if you find your inner housing child spooked by a headline, ask yourself, ‘What region or area are they talking about?’ Odds are, they have cherry-picked a statistic from somewhere and are trying to apply it everywhere else in one big brush stroke.

Ignore it.
Clicks and eyeballs follow fear, and threatening homeowners with ‘2008 Redux’ is a guaranteed way to get traffic to your site.
Telling one single story about 800 different markets isn’t even remotely accurate — so don’t fall for it.
Good reporting makes a distinction between regions and highlights the fact that each individual market is acting according to its own supply / demand dynamic — but we know that the majority of reporting is not good reporting.
And thus the reason I have a blog.